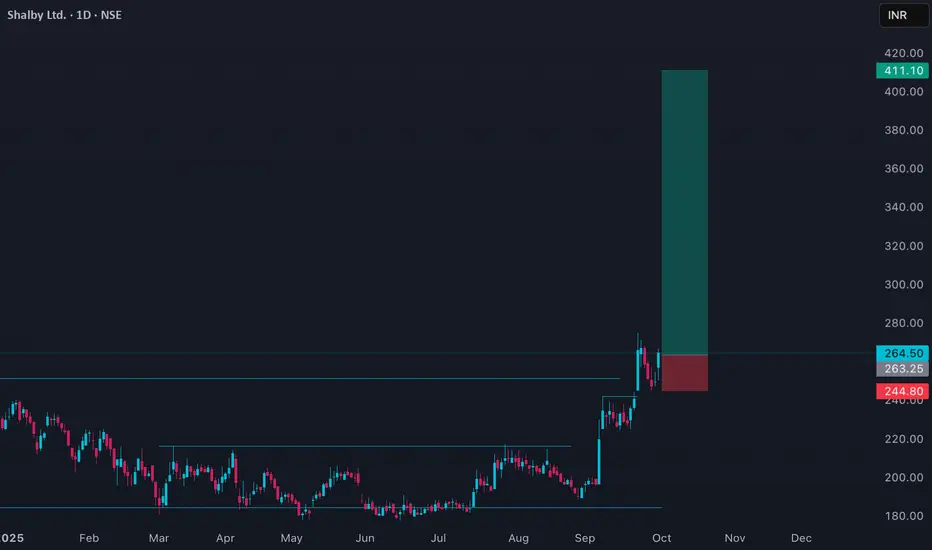
Shalby Limited (SHALBY) is currently in a strong uptrend, closing today at ₹264.85 with a gain of about 6.64%. The stock has traded between ₹250.05 and ₹266.60, showing high momentum and robust volume, indicating strong buying interest.
Price action reveals that SHALBY is trading well above both its 50-day average (~₹214.55) and 200-day average (~₹205.60), confirming the bullish trend. The stock is nearing its 52-week high of ₹282.30, which represents a critical resistance level to watch. Immediate support levels are around ₹250, providing a cushion against potential short-term corrections.
Technical indicators suggest the stock is in an overbought zone, so while the momentum is positive, some consolidation or profit-taking may occur near resistance. Overall, the price action signals continued strength and bullish sentiment, with potential for further upside if the stock breaks above the 52-week high on strong volume.
면책사항
해당 정보와 게시물은 금융, 투자, 트레이딩 또는 기타 유형의 조언이나 권장 사항으로 간주되지 않으며, 트레이딩뷰에서 제공하거나 보증하는 것이 아닙니다. 자세한 내용은 이용 약관을 참조하세요.
면책사항
해당 정보와 게시물은 금융, 투자, 트레이딩 또는 기타 유형의 조언이나 권장 사항으로 간주되지 않으며, 트레이딩뷰에서 제공하거나 보증하는 것이 아닙니다. 자세한 내용은 이용 약관을 참조하세요.