📈 #SAMMAANCAP | #TechnicalAnalysis
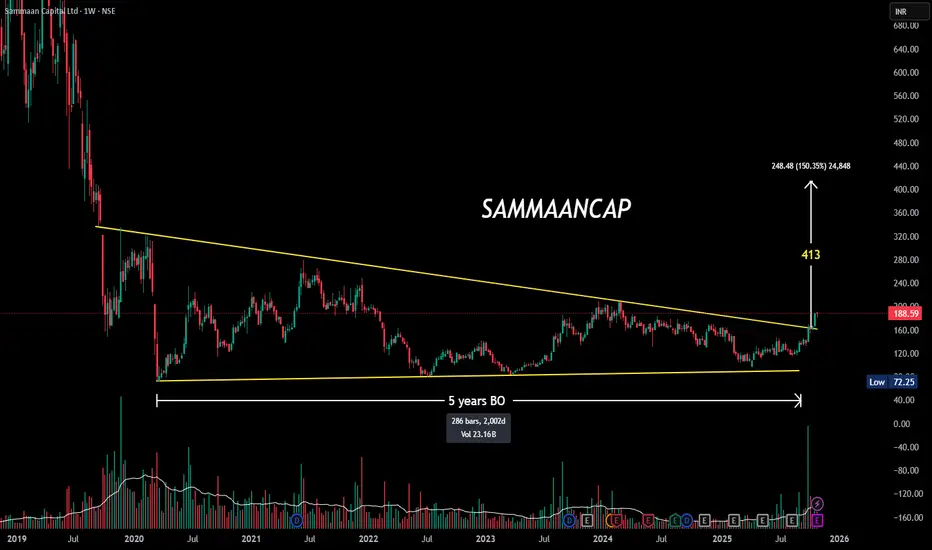
💥 5-Year Symmetrical Triangle Breakout at ₹165!
After a long consolidation, price breaks out with rising volume — a strong sign of trend reversal despite current negative earnings.
🔹 Pattern: Symmetrical Triangle
🔹 Breakout Zone: ₹165
🔹 CMP: ₹188
🔹 P/E: -5.9 (Loss-making)
🔹 P/BV: 0.7
🔹 Sector: Finance
⚙️ Sustaining above ₹165 could open room toward ₹220–₹240 over the medium term.
#PriceAction #BreakoutStocks #TradingView #ChartPatterns #SwingTrading #StockMarketIndia #TechnicalAnalysis #VolumeBreakout
면책사항
해당 정보와 게시물은 금융, 투자, 트레이딩 또는 기타 유형의 조언이나 권장 사항으로 간주되지 않으며, 트레이딩뷰에서 제공하거나 보증하는 것이 아닙니다. 자세한 내용은 이용 약관을 참조하세요.
면책사항
해당 정보와 게시물은 금융, 투자, 트레이딩 또는 기타 유형의 조언이나 권장 사항으로 간주되지 않으며, 트레이딩뷰에서 제공하거나 보증하는 것이 아닙니다. 자세한 내용은 이용 약관을 참조하세요.