Price Action :
Bollinger Bands :
Volume :
Key Support and Resistance :
Trend :
Conclusion :
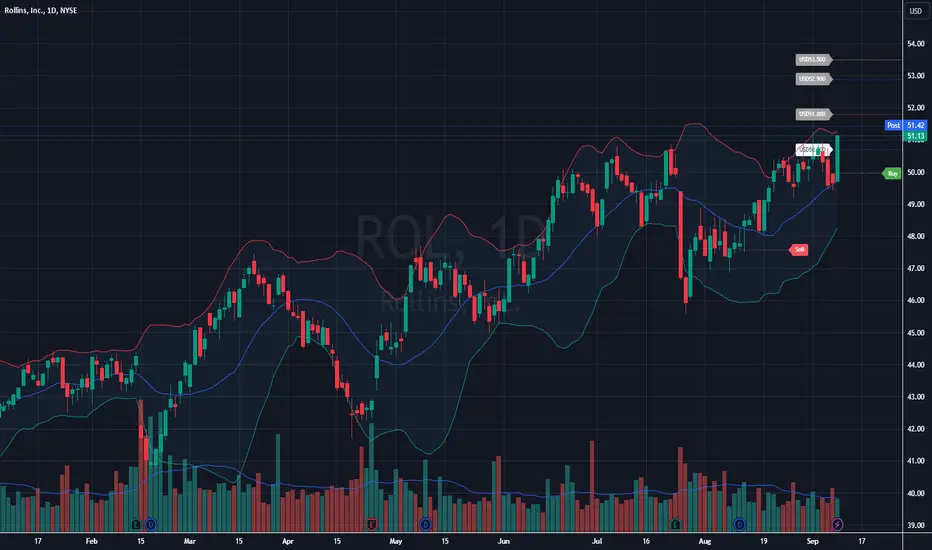
- The price recently bounced off the lower Bollinger Band, suggesting it may have found support near $49.00.
Bollinger Bands :
- The price is moving towards the upper Bollinger Band, indicating bullish momentum.
Volume :
- There has been a slight increase in volume accompanying the recent price rise, which can be a bullish sign of commitment from buyers.
Key Support and Resistance :
- Support: Around $49.00 (recent low and moving average level).
- Resistance: $52.00, which acted as a resistance level previously. A break above this level could trigger a further rally.
Trend :
- The short-term trend is bullish, as the price is climbing steadily towards the previous highs.
Conclusion :
- The stock is showing strength as it approaches a key resistance at $52.00. A breakout with volume would be a bullish signal for further upside. However, if it fails to break this level, there could be a pullback towards the $49.00 support level.
➀➁➂➃➄
면책사항
해당 정보와 게시물은 금융, 투자, 트레이딩 또는 기타 유형의 조언이나 권장 사항으로 간주되지 않으며, 트레이딩뷰에서 제공하거나 보증하는 것이 아닙니다. 자세한 내용은 이용 약관을 참조하세요.
➀➁➂➃➄
면책사항
해당 정보와 게시물은 금융, 투자, 트레이딩 또는 기타 유형의 조언이나 권장 사항으로 간주되지 않으며, 트레이딩뷰에서 제공하거나 보증하는 것이 아닙니다. 자세한 내용은 이용 약관을 참조하세요.