📊 TECHNICAL INDICATOR ANALYSIS – PNB BEARISH OUTLOOK
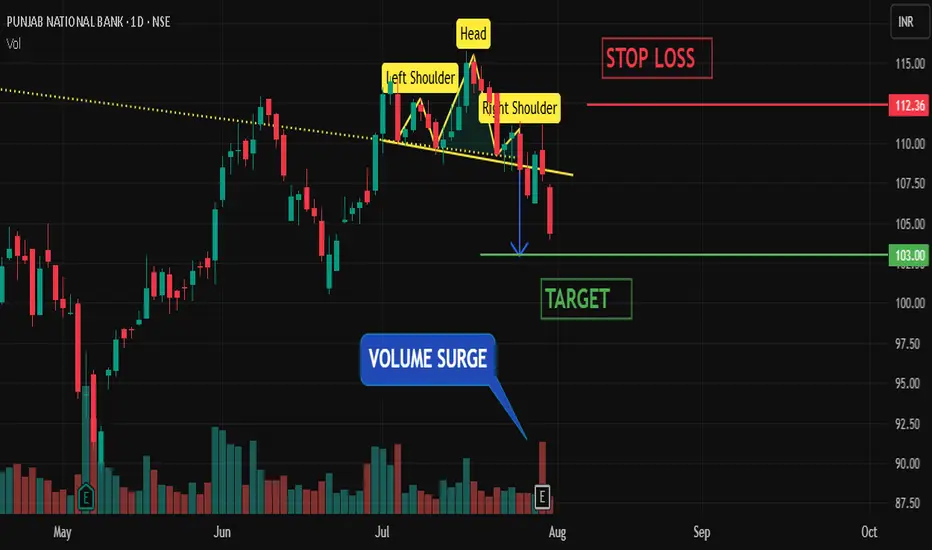
🔻 1. HEAD & SHOULDERS PATTERN FORMATION
PNB has formed a CLASSIC HEAD AND SHOULDERS PATTERN, a strong bearish reversal signal. The breakdown below the neckline confirms the end of the previous uptrend and suggests a shift in sentiment toward the downside.
📉 2. VOLUME SURGE ON BREAKDOWN :
A SIGNIFICANT SPIKE IN VOLUME was observed during the breakdown, reinforcing the bearish pattern. Volume confirmation is crucial, and in this case, it shows that sellers are aggressively stepping in to drive the price lower.
📉 3. BEARISH MACD CROSSOVER :

The MACD LINE HAS CROSSED BELOW THE SIGNAL LINE, a key momentum-based sell signal. This bearish crossover aligns with the breakdown and volume, indicating that downside momentum is likely to accelerate.
🎯 TRADE SETUP :
✅ TARGET: ₹103
❌ STOP LOSS: ₹112.5
🔻 1. HEAD & SHOULDERS PATTERN FORMATION
PNB has formed a CLASSIC HEAD AND SHOULDERS PATTERN, a strong bearish reversal signal. The breakdown below the neckline confirms the end of the previous uptrend and suggests a shift in sentiment toward the downside.
📉 2. VOLUME SURGE ON BREAKDOWN :
A SIGNIFICANT SPIKE IN VOLUME was observed during the breakdown, reinforcing the bearish pattern. Volume confirmation is crucial, and in this case, it shows that sellers are aggressively stepping in to drive the price lower.
📉 3. BEARISH MACD CROSSOVER :
The MACD LINE HAS CROSSED BELOW THE SIGNAL LINE, a key momentum-based sell signal. This bearish crossover aligns with the breakdown and volume, indicating that downside momentum is likely to accelerate.
🎯 TRADE SETUP :
✅ TARGET: ₹103
❌ STOP LOSS: ₹112.5
거래청산: 타겟 닿음
pnb has hit the desired target successfullyMy Social Media links :
📥 Instagram - instagram.com/sagar_trademaster/
📥 Youtube - youtube.com/@TruthfulTrader
📥 Instagram - instagram.com/sagar_trademaster/
📥 Youtube - youtube.com/@TruthfulTrader
면책사항
해당 정보와 게시물은 금융, 투자, 트레이딩 또는 기타 유형의 조언이나 권장 사항으로 간주되지 않으며, 트레이딩뷰에서 제공하거나 보증하는 것이 아닙니다. 자세한 내용은 이용 약관을 참조하세요.
My Social Media links :
📥 Instagram - instagram.com/sagar_trademaster/
📥 Youtube - youtube.com/@TruthfulTrader
📥 Instagram - instagram.com/sagar_trademaster/
📥 Youtube - youtube.com/@TruthfulTrader
면책사항
해당 정보와 게시물은 금융, 투자, 트레이딩 또는 기타 유형의 조언이나 권장 사항으로 간주되지 않으며, 트레이딩뷰에서 제공하거나 보증하는 것이 아닙니다. 자세한 내용은 이용 약관을 참조하세요.