🧠 Chart Analysis Summary:
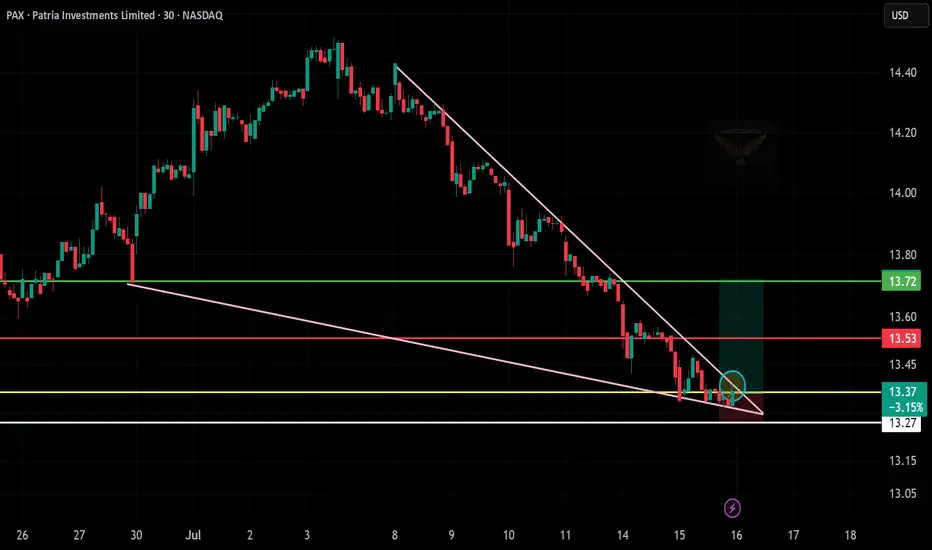
Pattern: Falling wedge breakout spotted — a classic bullish reversal pattern.
Current Price: $13.37
Support Zone:
$13.27 (white line, holding support)
Breakout Confirmation: Price is pushing out of the wedge with a small green move (circle).
📊 Key Levels:
Entry Zone: $13.35–$13.40
Target 1: $13.53 (red line – short-term resistance)
Target 2: $13.72 (green line – wedge target zone)
Stop-Loss: Below $13.25
🎯 Trade Idea (Bullish Bias):
Entry: $13.35–13.40
Target: $13.72
Stop-Loss: $13.25
면책사항
해당 정보와 게시물은 금융, 투자, 트레이딩 또는 기타 유형의 조언이나 권장 사항으로 간주되지 않으며, 트레이딩뷰에서 제공하거나 보증하는 것이 아닙니다. 자세한 내용은 이용 약관을 참조하세요.
면책사항
해당 정보와 게시물은 금융, 투자, 트레이딩 또는 기타 유형의 조언이나 권장 사항으로 간주되지 않으며, 트레이딩뷰에서 제공하거나 보증하는 것이 아닙니다. 자세한 내용은 이용 약관을 참조하세요.