📌 Current snapshot
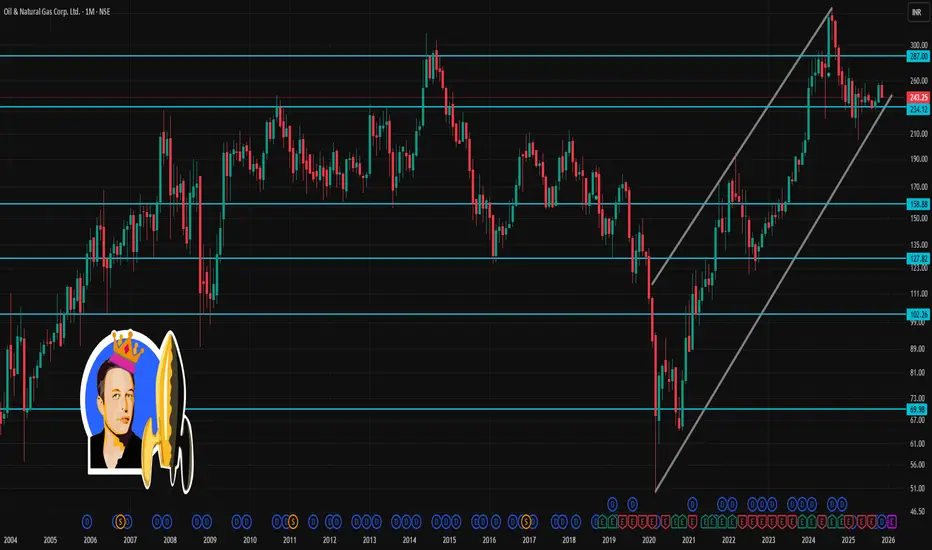
ONGC last traded around ₹243–₹244.
Over the past month, the stock has dropped ~3–4%.
📈 What could happen in next month
Bearish scenario: If price slips below ₹241 and sentiment (oil prices, global energy demand, investor flows) remains weak — ONGC could test the lower support zone around ₹238–₹240.
Neutral / range-bound: The stock could hover between ₹241–₹251, especially if crude/oil-sector news remains mixed, or broader market is choppy.
Bullish scenario: If ONGC closes above ~₹251 with supportive macro (oil prices, global demand, corporate news) — next leg could push it towards ₹255–₹257 (near-term target).
관련 발행물
면책사항
해당 정보와 게시물은 금융, 투자, 트레이딩 또는 기타 유형의 조언이나 권장 사항으로 간주되지 않으며, 트레이딩뷰에서 제공하거나 보증하는 것이 아닙니다. 자세한 내용은 이용 약관을 참조하세요.
관련 발행물
면책사항
해당 정보와 게시물은 금융, 투자, 트레이딩 또는 기타 유형의 조언이나 권장 사항으로 간주되지 않으며, 트레이딩뷰에서 제공하거나 보증하는 것이 아닙니다. 자세한 내용은 이용 약관을 참조하세요.