I opened a medium-term bearish position on NVDA by purchasing PUT options.
Here’s the full breakdown of the idea, entry logic, and projected targets.
🧠 Why I Entered the Trade
NVDA formed a clear Head & Shoulders (H&S) reversal pattern on the 4H chart — one of the strongest technical reversal signals after an extended bullish trend.
The neckline has now been broken, validating the structure and confirming bearish momentum.
The rejection from the right shoulder, combined with weakening RSI and loss of key market structure, provides additional confirmation.
🎯 My PUT Options Position
I purchased PUT contracts with a defined risk and leveraged downside exposure.
Break-Even Price: ~129 USD
This is the key level where:
the option premium is fully recovered
the position shifts from “loss” to “profit”
As long as NVDA trades below 129 USD before expiration, the position begins generating profit.
💰 Profit Projection
My profit target zone is around 102 USD.
At that level, the trade yields approximately:
➡️ +77,000 USD profit
This aligns with:
the measured target of the Head & Shoulders pattern
previous demand zone turning into resistance
Fibonacci extensions
a full correction of the last impulsive leg
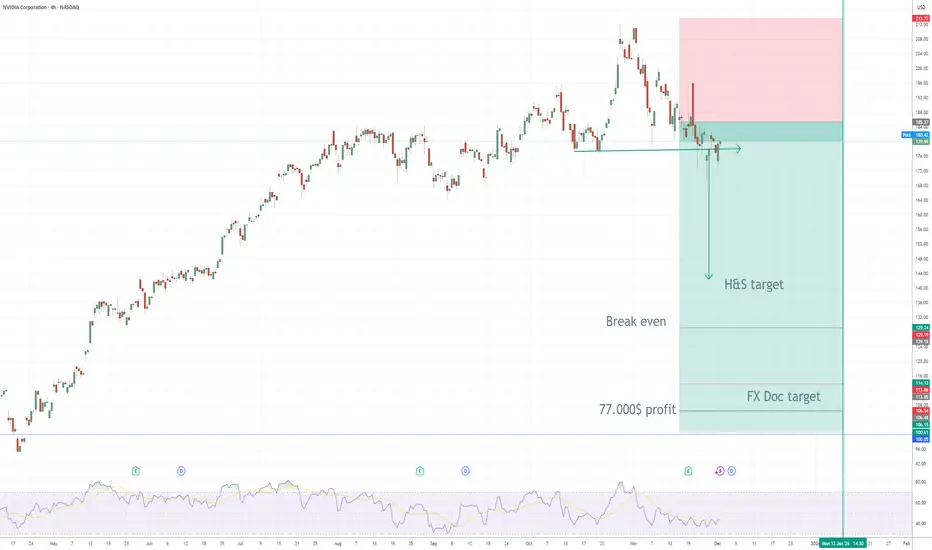
📌 Technical Breakdown
H&S target: ~160 → ~130 → projected extension toward 102
Break-even: 129 USD
FXDoctor target: 102 USD
Trend structure: Major lower lows forming
Momentum: RSI breakdown and bearish continuation signals
The chart clearly shows a potential shift from a hyper-parabolic bullish phase into a deeper correction — a move that benefits PUT buyers with asymmetric risk/reward.
🧨 Summary
I’m holding PUT options on NVDA
Break-even: 129 USD
Projected profit: ~77,000 USD at 102 USD
The trade is based on a clean and validated Head & Shoulders reversal
NVDA is showing early signs of a much larger bearish correction
Here’s the full breakdown of the idea, entry logic, and projected targets.
🧠 Why I Entered the Trade
NVDA formed a clear Head & Shoulders (H&S) reversal pattern on the 4H chart — one of the strongest technical reversal signals after an extended bullish trend.
The neckline has now been broken, validating the structure and confirming bearish momentum.
The rejection from the right shoulder, combined with weakening RSI and loss of key market structure, provides additional confirmation.
🎯 My PUT Options Position
I purchased PUT contracts with a defined risk and leveraged downside exposure.
Break-Even Price: ~129 USD
This is the key level where:
the option premium is fully recovered
the position shifts from “loss” to “profit”
As long as NVDA trades below 129 USD before expiration, the position begins generating profit.
💰 Profit Projection
My profit target zone is around 102 USD.
At that level, the trade yields approximately:
➡️ +77,000 USD profit
This aligns with:
the measured target of the Head & Shoulders pattern
previous demand zone turning into resistance
Fibonacci extensions
a full correction of the last impulsive leg
📌 Technical Breakdown
H&S target: ~160 → ~130 → projected extension toward 102
Break-even: 129 USD
FXDoctor target: 102 USD
Trend structure: Major lower lows forming
Momentum: RSI breakdown and bearish continuation signals
The chart clearly shows a potential shift from a hyper-parabolic bullish phase into a deeper correction — a move that benefits PUT buyers with asymmetric risk/reward.
🧨 Summary
I’m holding PUT options on NVDA
Break-even: 129 USD
Projected profit: ~77,000 USD at 102 USD
The trade is based on a clean and validated Head & Shoulders reversal
NVDA is showing early signs of a much larger bearish correction
Broćeta
면책사항
해당 정보와 게시물은 금융, 투자, 트레이딩 또는 기타 유형의 조언이나 권장 사항으로 간주되지 않으며, 트레이딩뷰에서 제공하거나 보증하는 것이 아닙니다. 자세한 내용은 이용 약관을 참조하세요.
Broćeta
면책사항
해당 정보와 게시물은 금융, 투자, 트레이딩 또는 기타 유형의 조언이나 권장 사항으로 간주되지 않으며, 트레이딩뷰에서 제공하거나 보증하는 것이 아닙니다. 자세한 내용은 이용 약관을 참조하세요.