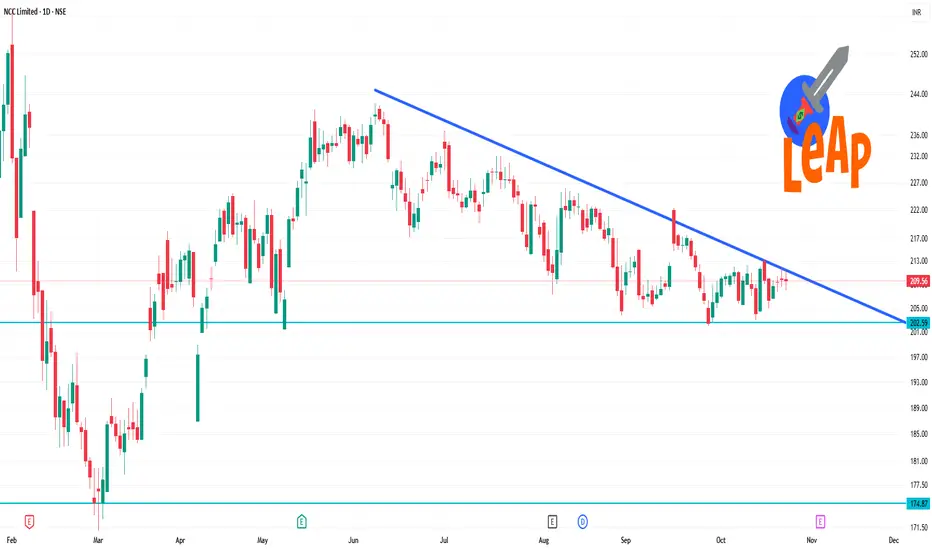
✅ Key data & current state
The stock is trading around ~₹ 206-₹ 209 as quoted recently.
On the daily chart:
14-day RSI is ~54 (neutral zone) according to one source.
Moving averages: 5-day MA ~208.19, 50-day ~208.28 (both slightly above current price) → bullish sign short term.
200-day MA ~209.77 is slightly above current price, meaning price is just below a longer-term average.
Technical indicators show mixed signals: some “buy” signals from moving averages, but overall “neutral” from aggregate indicators.
관련 발행물
면책사항
이 정보와 게시물은 TradingView에서 제공하거나 보증하는 금융, 투자, 거래 또는 기타 유형의 조언이나 권고 사항을 의미하거나 구성하지 않습니다. 자세한 내용은 이용 약관을 참고하세요.
관련 발행물
면책사항
이 정보와 게시물은 TradingView에서 제공하거나 보증하는 금융, 투자, 거래 또는 기타 유형의 조언이나 권고 사항을 의미하거나 구성하지 않습니다. 자세한 내용은 이용 약관을 참고하세요.