Meta Platforms (META) Shares Fall to Key Support
In November, Meta Platforms (META) shares have shown bearish momentum following the company’s quarterly report, which included a one-off income tax expense of $15.93 billion (as previously noted).
Investor concerns have been further fuelled by the company’s plans to raise capital expenditure to $70–72 billion in 2025, aimed at expanding data centre infrastructure and acquiring AI chips. However, after a decline of more than 20% from the autumn peak, bulls may soon attempt a comeback.

Technical Analysis of META
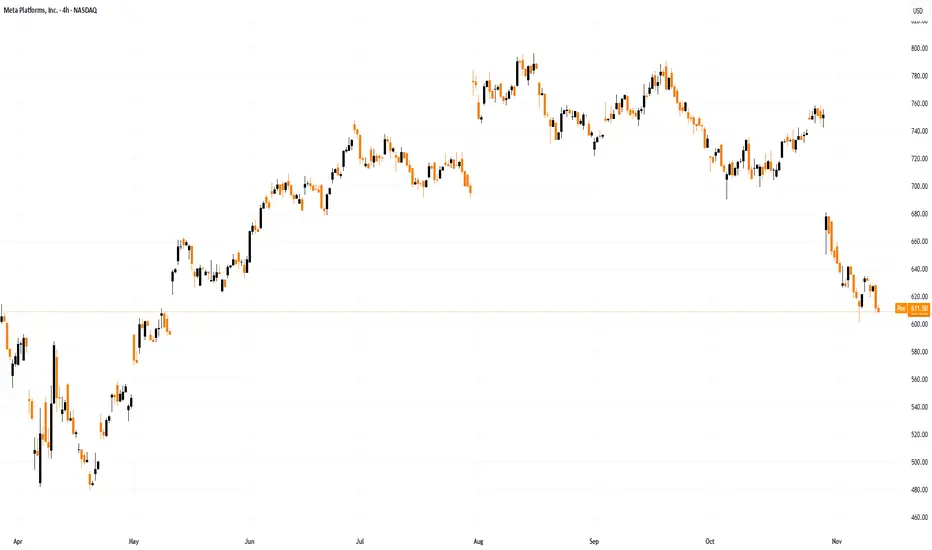
When analysing META’s chart on 31 October, a descending channel (shown in red) was identified. As of today, the share price has reached a support block formed by the following key elements:
→ the lower boundary of the descending channel;
→ the psychological level of $600 per share;
→ and the May bullish gap area.
It is also worth noting that the RSI is approaching oversold territory, and a false bearish breakout below the $600 psychological level could create a bullish divergence.
Therefore, it cannot be ruled out that:
→ the November decline has already priced in the post-earnings concerns;
→ and that bulls may use this support zone as a springboard to resume the broader uptrend.
This article represents the opinion of the Companies operating under the FXOpen brand only. It is not to be construed as an offer, solicitation, or recommendation with respect to products and services provided by the Companies operating under the FXOpen brand, nor is it to be considered financial advice.
In November, Meta Platforms (META) shares have shown bearish momentum following the company’s quarterly report, which included a one-off income tax expense of $15.93 billion (as previously noted).
Investor concerns have been further fuelled by the company’s plans to raise capital expenditure to $70–72 billion in 2025, aimed at expanding data centre infrastructure and acquiring AI chips. However, after a decline of more than 20% from the autumn peak, bulls may soon attempt a comeback.
Technical Analysis of META
When analysing META’s chart on 31 October, a descending channel (shown in red) was identified. As of today, the share price has reached a support block formed by the following key elements:
→ the lower boundary of the descending channel;
→ the psychological level of $600 per share;
→ and the May bullish gap area.
It is also worth noting that the RSI is approaching oversold territory, and a false bearish breakout below the $600 psychological level could create a bullish divergence.
Therefore, it cannot be ruled out that:
→ the November decline has already priced in the post-earnings concerns;
→ and that bulls may use this support zone as a springboard to resume the broader uptrend.
This article represents the opinion of the Companies operating under the FXOpen brand only. It is not to be construed as an offer, solicitation, or recommendation with respect to products and services provided by the Companies operating under the FXOpen brand, nor is it to be considered financial advice.
면책사항
해당 정보와 게시물은 금융, 투자, 트레이딩 또는 기타 유형의 조언이나 권장 사항으로 간주되지 않으며, 트레이딩뷰에서 제공하거나 보증하는 것이 아닙니다. 자세한 내용은 이용 약관을 참조하세요.
면책사항
해당 정보와 게시물은 금융, 투자, 트레이딩 또는 기타 유형의 조언이나 권장 사항으로 간주되지 않으며, 트레이딩뷰에서 제공하거나 보증하는 것이 아닙니다. 자세한 내용은 이용 약관을 참조하세요.