This analysis is intended solely for educational purposes and does not constitute financial advice.
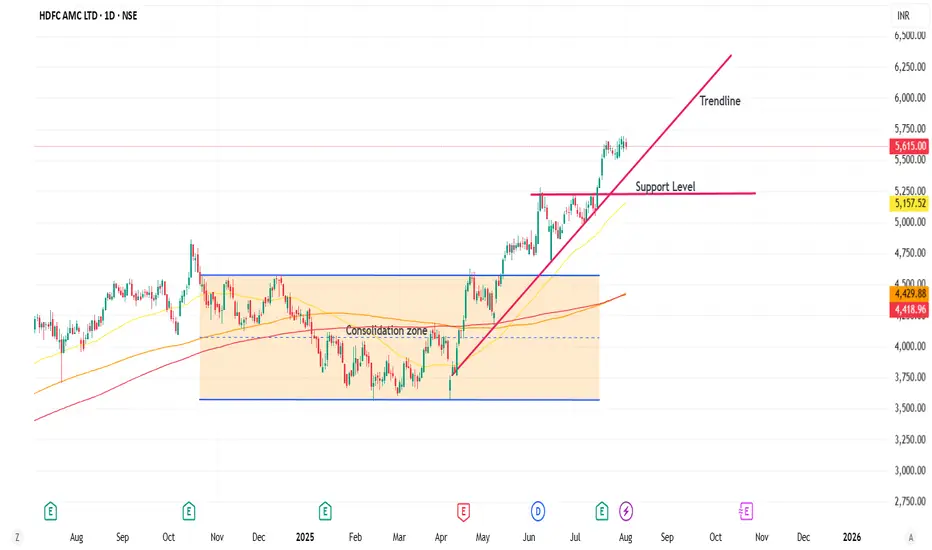
The stock of HDFC Asset Management Company (HDFC AMC) is currently demonstrating a gradual upward trajectory following a breakout from a seven-month consolidation phase. This breakout signals renewed bullish momentum in the stock's price action.
Key technical indicators support this trend:
• ✅ Trading above major moving averages: The stock is positioned above the 200-day, 150-day, and 50-day moving averages, which typically indicates strong underlying support and a positive long-term outlook.
• ✅ Holding above a critical support level: This reinforces the bullish sentiment and reduces the likelihood of a sharp downside reversal in the near term.
Given these technical factors, there is a high probability of continued upward movement. However, it is essential to approach trading with caution. 📌
면책사항
해당 정보와 게시물은 금융, 투자, 트레이딩 또는 기타 유형의 조언이나 권장 사항으로 간주되지 않으며, 트레이딩뷰에서 제공하거나 보증하는 것이 아닙니다. 자세한 내용은 이용 약관을 참조하세요.
면책사항
해당 정보와 게시물은 금융, 투자, 트레이딩 또는 기타 유형의 조언이나 권장 사항으로 간주되지 않으며, 트레이딩뷰에서 제공하거나 보증하는 것이 아닙니다. 자세한 내용은 이용 약관을 참조하세요.