#HCL Technologies Limited - Technical Analysis
Price: 1,683.00 |
#Trade Setup - Bullish Reversal
#Outlook
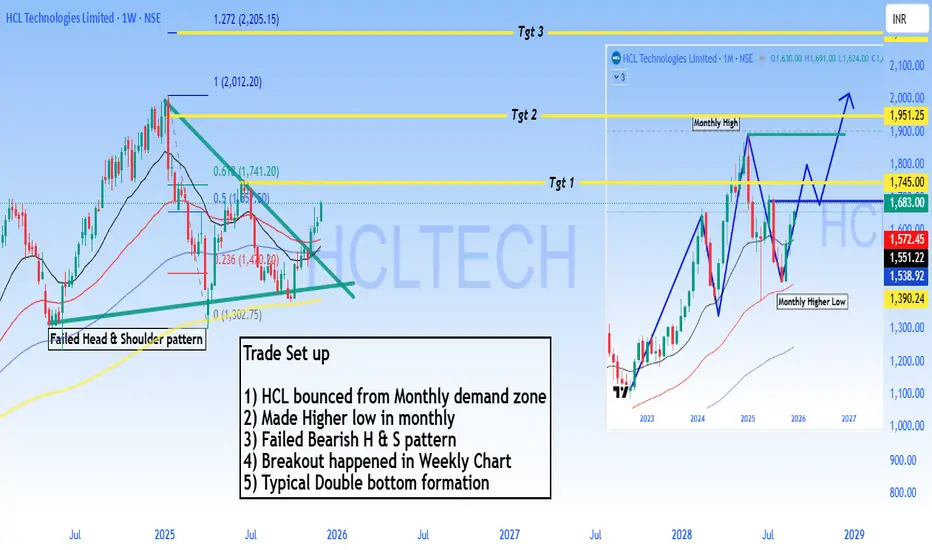
Strong bullish setup with 4-35% upside potential. The failed bearish head & shoulder pattern combined with monthly demand zone bounce suggests institutional accumulation. Breakout above 1,745 opens path to 1,951 and beyond.
Pattern Analysis:
1. Bounced from monthly demand zone - Strong support established
2. Made higher low in monthly chart - Trend reversal signal
3. Failed Bearish Head & Shoulders pattern - Bears trapped, bullish continuation
4. Breakout confirmed on weekly chart - Momentum shift
5. Typical double bottom formation - Classic reversal pattern
Technical Structure:
- Monthly higher low at 1,390 confirms bullish structure
- Failed H&S pattern invalidation is highly bullish
- Price now targeting previous resistance zones
Target Levels:
- Target 1: 1,745.00
- Target 2: 1,951.25
- Target 3: 2,272.70
Support: 1,572 - 1,551 (critical zone)
⚠️ DISCLAIMER
**NOT investment advice.** Educational analysis only. Trading involves substantial risk of loss. Past patterns don't guarantee future results. Always do your own research and consult a SEBI-registered financial advisor. Author assumes no responsibility for losses.
#HCLTech #StockMarket #NSE #TechnicalAnalysis #ITStocks #IndianStockMarket #SwingTrading #Trading #FinTwit #TradingView #ChartAnalysis #StocksToWatch #Nifty50 #TechStocks
Price: 1,683.00 |
#Trade Setup - Bullish Reversal
#Outlook
Strong bullish setup with 4-35% upside potential. The failed bearish head & shoulder pattern combined with monthly demand zone bounce suggests institutional accumulation. Breakout above 1,745 opens path to 1,951 and beyond.
Pattern Analysis:
1. Bounced from monthly demand zone - Strong support established
2. Made higher low in monthly chart - Trend reversal signal
3. Failed Bearish Head & Shoulders pattern - Bears trapped, bullish continuation
4. Breakout confirmed on weekly chart - Momentum shift
5. Typical double bottom formation - Classic reversal pattern
Technical Structure:
- Monthly higher low at 1,390 confirms bullish structure
- Failed H&S pattern invalidation is highly bullish
- Price now targeting previous resistance zones
Target Levels:
- Target 1: 1,745.00
- Target 2: 1,951.25
- Target 3: 2,272.70
Support: 1,572 - 1,551 (critical zone)
⚠️ DISCLAIMER
**NOT investment advice.** Educational analysis only. Trading involves substantial risk of loss. Past patterns don't guarantee future results. Always do your own research and consult a SEBI-registered financial advisor. Author assumes no responsibility for losses.
#HCLTech #StockMarket #NSE #TechnicalAnalysis #ITStocks #IndianStockMarket #SwingTrading #Trading #FinTwit #TradingView #ChartAnalysis #StocksToWatch #Nifty50 #TechStocks
관련 발행물
면책사항
해당 정보와 게시물은 금융, 투자, 트레이딩 또는 기타 유형의 조언이나 권장 사항으로 간주되지 않으며, 트레이딩뷰에서 제공하거나 보증하는 것이 아닙니다. 자세한 내용은 이용 약관을 참조하세요.
면책사항
해당 정보와 게시물은 금융, 투자, 트레이딩 또는 기타 유형의 조언이나 권장 사항으로 간주되지 않으며, 트레이딩뷰에서 제공하거나 보증하는 것이 아닙니다. 자세한 내용은 이용 약관을 참조하세요.