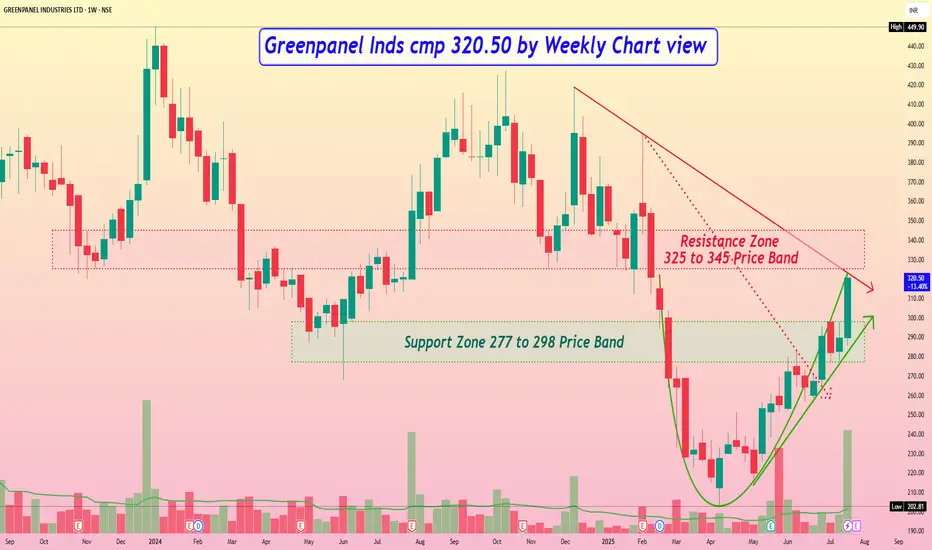
Greenpanel Inds cmp 320.50 by Weekly Chart view
- Support Zone 277 to 298 Price Band
- Resistance Zone 325 to 345 Price Band
- Bullish Rounding Bottom with Resistance Zone neckline
- Rising Support Trendline seems well respected by price momentum
- Volumes have surged very heavily over past week by demand based buying
- 1st Falling Resistance Trendline Brake out done and 2nd Trendline Breakout attempted
- Most common Technical Indicators like BB, EMA, MACD, RSI, SAR are showing positive trend
면책사항
해당 정보와 게시물은 금융, 투자, 트레이딩 또는 기타 유형의 조언이나 권장 사항으로 간주되지 않으며, 트레이딩뷰에서 제공하거나 보증하는 것이 아닙니다. 자세한 내용은 이용 약관을 참조하세요.
면책사항
해당 정보와 게시물은 금융, 투자, 트레이딩 또는 기타 유형의 조언이나 권장 사항으로 간주되지 않으며, 트레이딩뷰에서 제공하거나 보증하는 것이 아닙니다. 자세한 내용은 이용 약관을 참조하세요.