Weekly Roundup: FCPO as of October 10, 2025
Market Stance & Technical Bias
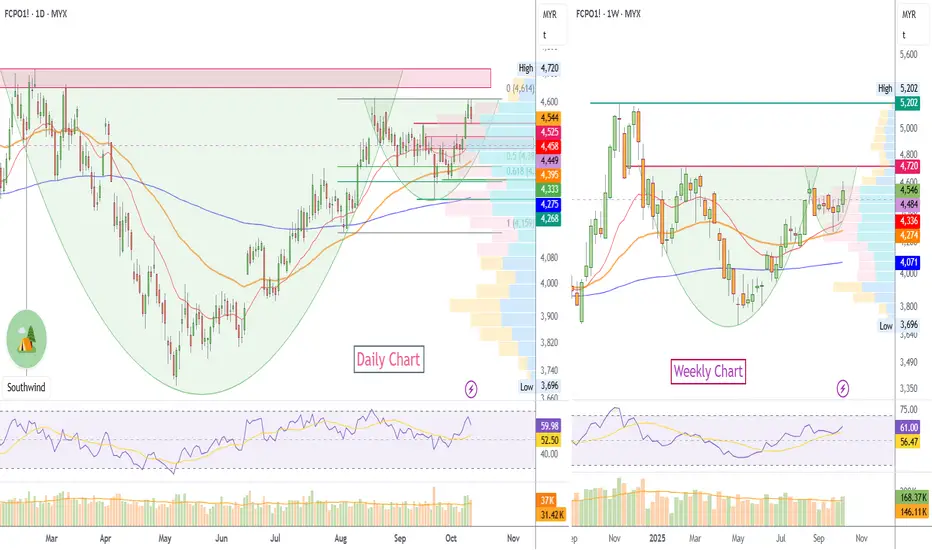
Stance: Bullish, based on a valid cup and handle formation evident across both daily and weekly timeframes.
Confidence Level: High for bullish continuation upon confirmation; medium until a decisive breakout is observed.
Price Action & Trend Structure
Cup and Handle Formation:
- Classic rounding bottom (“cup”) developed over multiple months, with a minor handle consolidation at the rim (4,614 MYR).FCPO1-_2025-10-11_21-34-16.jpg
- This pattern is one of the most reliable bullish continuation setups, especially when confirmed by increasing volume on breakout.
Trend Dynamics:
- Daily and weekly charts show sustained series of higher lows from the cup base (~3,700 MYR) up to the rim area.FCPO1-_2025-10-11_21-34-16.jpg
- The handle features shallow retracement, suggesting strong buyer interest and a controlled, healthy setup.
Key Technical Levels
| Level | Significance |
| --- | --- |
| 4,614 MYR | Cup rim; breakout trigger |
| 4,444–4,458 MYR | Handle support, minor pullback region |
| 4,268 MYR | Major trend support, bullish invalidation threshold |
| 5,200 MYR | Initial upside target post-breakout |
| 5,630–5,740 MYR | Measured move target for full pattern completion |
Candlestick & Volume Analysis
- Bullish price builds, with candles showing long lower wicks and closing nearer session highs just below rim resistance.FCPO1-_2025-10-11_21-34-16.jpg
- Volume has contracted during handle formation and increased on rallies to the resistance—ideal structure for an imminent technical breakout.FCPO1-_2025-10-11_21-34-16.jpg
- Watch for day/weekly closes above 4,614 MYR with volume surging 20–30% above recent averages to confirm the breakout and limit false signals.FCPO1-_2025-10-11_21-34-16.jpg
Trading Plan
**Entry:** Initiate long position only on clear daily/weekly close above 4,614 MYR with confirming volume.FCPO1-_2025-10-11_21-34-16.jpg
**Stop-loss:** Below handle lows (around 4,420 MYR) to manage breakout failure risk.
**Upside targets:**
- First: 5,200 MYR
- Second: measured-move target near 5,630–5,740 MYR (cup depth projection).
Risk management: Avoid anticipation; confirm breakout with price and volume. Tight stop-loss placement recommended.
Immediate Action Points
- Monitor price consolidation below 4,614 for compressing ranges and accumulation, indicating imminent momentum.
- Volume analysis critical—breakout must coincide with notably higher volume to validate move.
Summary Table
| Technical Signal | Status as of Oct 10, 2025 |
| --- | --- |
| Cup & handle valid? | Yes, clearly formed |
| Breakout entry level | 4,614 MYR |
| Confirmation needed | Price close + strong volume |
| Stop loss | 4,420 MYR |
| First target | 5,200 MYR |
| Full pattern target | 5,630–5,740 MYR |
Weekly Summary:
The FCPO chart as of October 10, 2025 presents a classic bullish cup and handle pattern. Traders should wait for a decisive daily or weekly close above 4,614 MYR, supported by robust volume, before acting. Initial and measured-move targets offer strong risk/reward if the breakout is confirmed. Immediate invalidation occurs below 4,420 MYR, while a failure at 4,614 MYR warrants patience until renewed bullish signals appear.
This analysis discounts all fundamental inputs and is driven entirely by price structure and technical expectation for FCPO.
Market Stance & Technical Bias
Stance: Bullish, based on a valid cup and handle formation evident across both daily and weekly timeframes.
Confidence Level: High for bullish continuation upon confirmation; medium until a decisive breakout is observed.
Price Action & Trend Structure
Cup and Handle Formation:
- Classic rounding bottom (“cup”) developed over multiple months, with a minor handle consolidation at the rim (4,614 MYR).FCPO1-_2025-10-11_21-34-16.jpg
- This pattern is one of the most reliable bullish continuation setups, especially when confirmed by increasing volume on breakout.
Trend Dynamics:
- Daily and weekly charts show sustained series of higher lows from the cup base (~3,700 MYR) up to the rim area.FCPO1-_2025-10-11_21-34-16.jpg
- The handle features shallow retracement, suggesting strong buyer interest and a controlled, healthy setup.
Key Technical Levels
| Level | Significance |
| --- | --- |
| 4,614 MYR | Cup rim; breakout trigger |
| 4,444–4,458 MYR | Handle support, minor pullback region |
| 4,268 MYR | Major trend support, bullish invalidation threshold |
| 5,200 MYR | Initial upside target post-breakout |
| 5,630–5,740 MYR | Measured move target for full pattern completion |
Candlestick & Volume Analysis
- Bullish price builds, with candles showing long lower wicks and closing nearer session highs just below rim resistance.FCPO1-_2025-10-11_21-34-16.jpg
- Volume has contracted during handle formation and increased on rallies to the resistance—ideal structure for an imminent technical breakout.FCPO1-_2025-10-11_21-34-16.jpg
- Watch for day/weekly closes above 4,614 MYR with volume surging 20–30% above recent averages to confirm the breakout and limit false signals.FCPO1-_2025-10-11_21-34-16.jpg
Trading Plan
**Entry:** Initiate long position only on clear daily/weekly close above 4,614 MYR with confirming volume.FCPO1-_2025-10-11_21-34-16.jpg
**Stop-loss:** Below handle lows (around 4,420 MYR) to manage breakout failure risk.
**Upside targets:**
- First: 5,200 MYR
- Second: measured-move target near 5,630–5,740 MYR (cup depth projection).
Risk management: Avoid anticipation; confirm breakout with price and volume. Tight stop-loss placement recommended.
Immediate Action Points
- Monitor price consolidation below 4,614 for compressing ranges and accumulation, indicating imminent momentum.
- Volume analysis critical—breakout must coincide with notably higher volume to validate move.
Summary Table
| Technical Signal | Status as of Oct 10, 2025 |
| --- | --- |
| Cup & handle valid? | Yes, clearly formed |
| Breakout entry level | 4,614 MYR |
| Confirmation needed | Price close + strong volume |
| Stop loss | 4,420 MYR |
| First target | 5,200 MYR |
| Full pattern target | 5,630–5,740 MYR |
Weekly Summary:
The FCPO chart as of October 10, 2025 presents a classic bullish cup and handle pattern. Traders should wait for a decisive daily or weekly close above 4,614 MYR, supported by robust volume, before acting. Initial and measured-move targets offer strong risk/reward if the breakout is confirmed. Immediate invalidation occurs below 4,420 MYR, while a failure at 4,614 MYR warrants patience until renewed bullish signals appear.
This analysis discounts all fundamental inputs and is driven entirely by price structure and technical expectation for FCPO.
면책사항
해당 정보와 게시물은 금융, 투자, 트레이딩 또는 기타 유형의 조언이나 권장 사항으로 간주되지 않으며, 트레이딩뷰에서 제공하거나 보증하는 것이 아닙니다. 자세한 내용은 이용 약관을 참조하세요.
면책사항
해당 정보와 게시물은 금융, 투자, 트레이딩 또는 기타 유형의 조언이나 권장 사항으로 간주되지 않으며, 트레이딩뷰에서 제공하거나 보증하는 것이 아닙니다. 자세한 내용은 이용 약관을 참조하세요.