Educational EUR/USD Chart Breakdown – Price Action at Key Levels
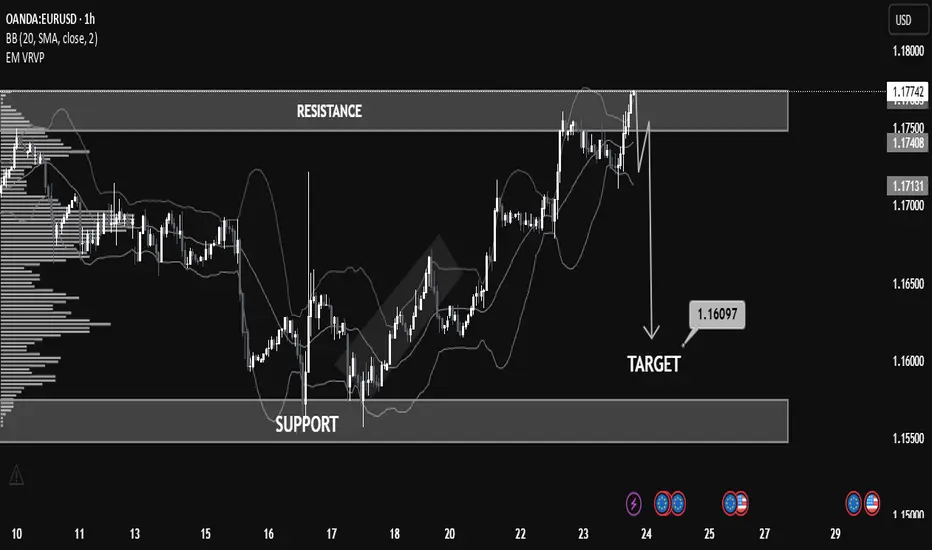
This EUR/USD (1-hour) chart provides a great example of how support and resistance zones, combined with price action and indicators like Bollinger Bands, can help anticipate market moves.
🔹 Resistance Zone Tested:
The pair recently approached the 1.17500–1.17800 resistance zone. This level had previously acted as a supply zone, and price once again showed rejection here, indicating selling pressure.
🔹 Bollinger Band Overextension:
Notice how the price extended beyond the upper Bollinger Band—this often signals that the market is overbought in the short term, leading to a potential reversal or correction.
🔹 Bearish Reaction & Target:
After rejection from resistance, the chart outlines a bearish move with a target at 1.16097. This level lies just above the next strong support zone (1.15500–1.16100), offering a realistic area for price to stabilize if the downtrend continues.
🔹 What to Learn:
Support & Resistance: Prices often react at key zones; previous resistance can turn into support and vice versa.
Confluence Tools: Use indicators like Bollinger Bands with price structure to increase confidence.
Target Planning: Identify likely reaction zones for risk management and profit-taking.
📚 Summary
This setup is a clean example of trading within a range and using technical confluence to plan entries and exits. If price breaks below 1.17130 with strong momentum, the probability increases for the market to reach the 1.16097 target.
Expert Gold Analyst | XAU/USD
Mastery Unlock trading success with premium strategies!
Exclusive signals & live trades.& pro education
Daily updates for all VIP members Join our active Telegram traders hub: t.me/Mentor_Michael033
Mastery Unlock trading success with premium strategies!
Exclusive signals & live trades.& pro education
Daily updates for all VIP members Join our active Telegram traders hub: t.me/Mentor_Michael033
면책사항
해당 정보와 게시물은 금융, 투자, 트레이딩 또는 기타 유형의 조언이나 권장 사항으로 간주되지 않으며, 트레이딩뷰에서 제공하거나 보증하는 것이 아닙니다. 자세한 내용은 이용 약관을 참조하세요.