A “Dragonfly” doji depicts a day on which prices opened high, sold off, and then returned to the opening price. Dragonflies are fairly infrequent. When they do occur, however, they often resolve bullishly (provided the Forex pair is not already overbought as show by Bollinger bands and indicators such as stochastic).
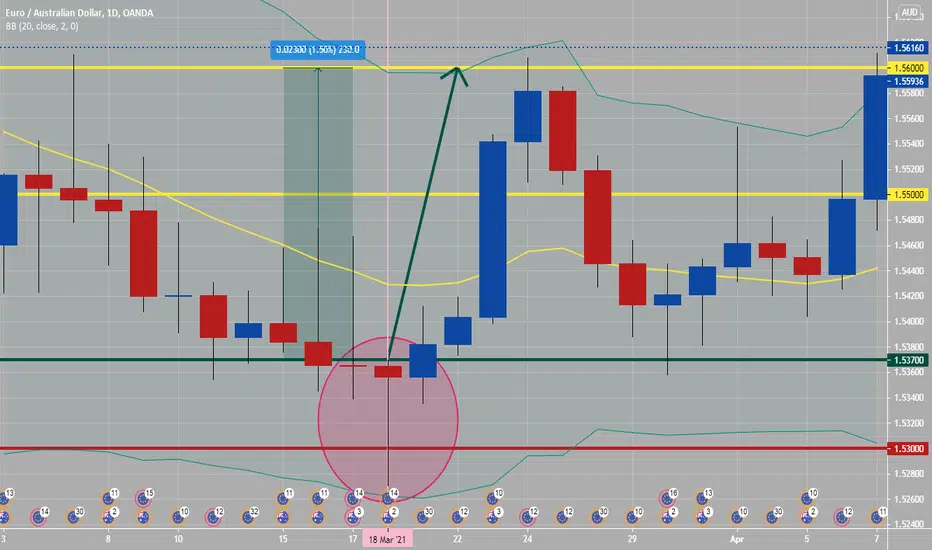
See daily attached chart of dragon fly candle, which was oversold and located at the lower band of Bollinger bands and at round numbers from 1.53000 to 1.53700. This is a great candlestick to plan for price action to continue to be bullish from, especially if this happened early in week. Noted dragonfly doji happened on a Thursday and lasted for around five days.
See daily attached chart of dragon fly candle, which was oversold and located at the lower band of Bollinger bands and at round numbers from 1.53000 to 1.53700. This is a great candlestick to plan for price action to continue to be bullish from, especially if this happened early in week. Noted dragonfly doji happened on a Thursday and lasted for around five days.
면책사항
해당 정보와 게시물은 금융, 투자, 트레이딩 또는 기타 유형의 조언이나 권장 사항으로 간주되지 않으며, 트레이딩뷰에서 제공하거나 보증하는 것이 아닙니다. 자세한 내용은 이용 약관을 참조하세요.
면책사항
해당 정보와 게시물은 금융, 투자, 트레이딩 또는 기타 유형의 조언이나 권장 사항으로 간주되지 않으며, 트레이딩뷰에서 제공하거나 보증하는 것이 아닙니다. 자세한 내용은 이용 약관을 참조하세요.