ETH/USDT Weekly Chart Analysis.
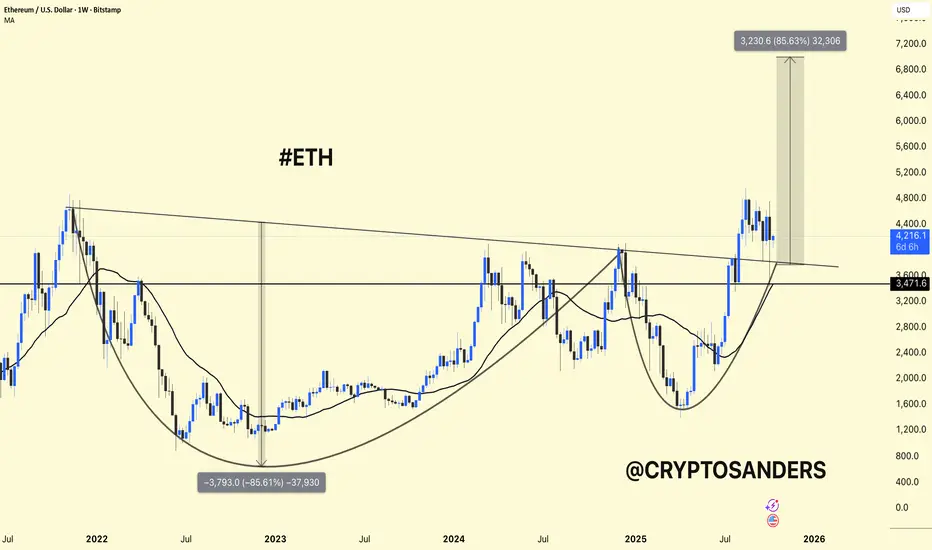
Structure: The chart shows a large cup-and-handle pattern – a classic bullish formation that signals a long-term trend reversal.
Current Price: Around $4,150, trading above the $3,470-$3,600 support area, which was the previous breakout area.
Moving Average (MA): ETH remains above the weekly MA (~$3,460) – confirming bullish momentum.
Breakout Area: The key downtrend line of 2022 has already been broken to the upside, showing strength.
Upside Target: If ETH maintains a price above $3,600, a potential upside move towards $7,000-$7,200 (≈ approximately +85%) is possible, as shown in the chart.
ETH is consolidating after its breakout, remaining stable above its support level.
Holding $3,600 → Bullish momentum likely to continue.
Loss of $3,400 → Could trigger a deeper decline towards $3,000.
DYOR | NFA
관련 발행물
면책사항
해당 정보와 게시물은 금융, 투자, 트레이딩 또는 기타 유형의 조언이나 권장 사항으로 간주되지 않으며, 트레이딩뷰에서 제공하거나 보증하는 것이 아닙니다. 자세한 내용은 이용 약관을 참조하세요.
관련 발행물
면책사항
해당 정보와 게시물은 금융, 투자, 트레이딩 또는 기타 유형의 조언이나 권장 사항으로 간주되지 않으며, 트레이딩뷰에서 제공하거나 보증하는 것이 아닙니다. 자세한 내용은 이용 약관을 참조하세요.