DXY (US Dollar Index): Seen in a Weekly Chart Perspective
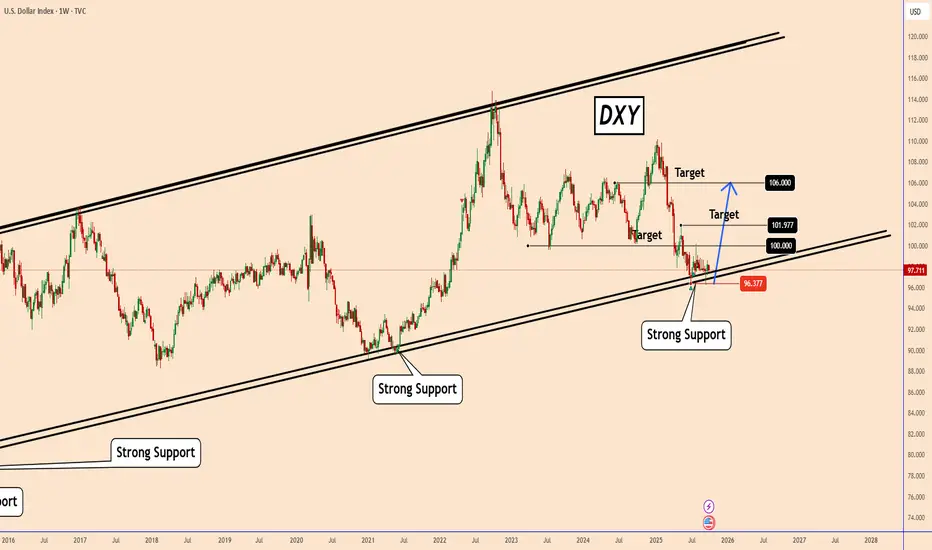
The chart shows DXY is sitting on a long-term ascending support line that has held multiple times since 2015. Price recently tested this support again near 96.37, making it a key level.
Price is around 97.70, close to support. This zone is crucial: as long as it holds, the bias remains for a bounce.
🎯 Key Targets:
First target: 100.00 (psychological target)
Second target: 101.97
Third target: 106.00
If DXY breaks and closes below 96.37, it could invalidate the bullish outlook and open space toward 94.00–92.00 levels.
The Dollar Index is at a critical support zone. If buyers defend this area, we could see a rebound toward 100–106. But if support fails, further downside could follow.
You may find more details in the chart!
Thank you and Good Luck!
❤️PS: Please support with a like or comment if you find this analysis useful for your trading day❤️
✅MY FREE Signals Channel
t.me/TradingPuzzles
✅Personal Telegram
t.me/KlejdiCuni
✅Suggested News Channel
t.me/ForexNewsNavigator_Official
t.me/TradingPuzzles
✅Personal Telegram
t.me/KlejdiCuni
✅Suggested News Channel
t.me/ForexNewsNavigator_Official
면책사항
해당 정보와 게시물은 금융, 투자, 트레이딩 또는 기타 유형의 조언이나 권장 사항으로 간주되지 않으며, 트레이딩뷰에서 제공하거나 보증하는 것이 아닙니다. 자세한 내용은 이용 약관을 참조하세요.