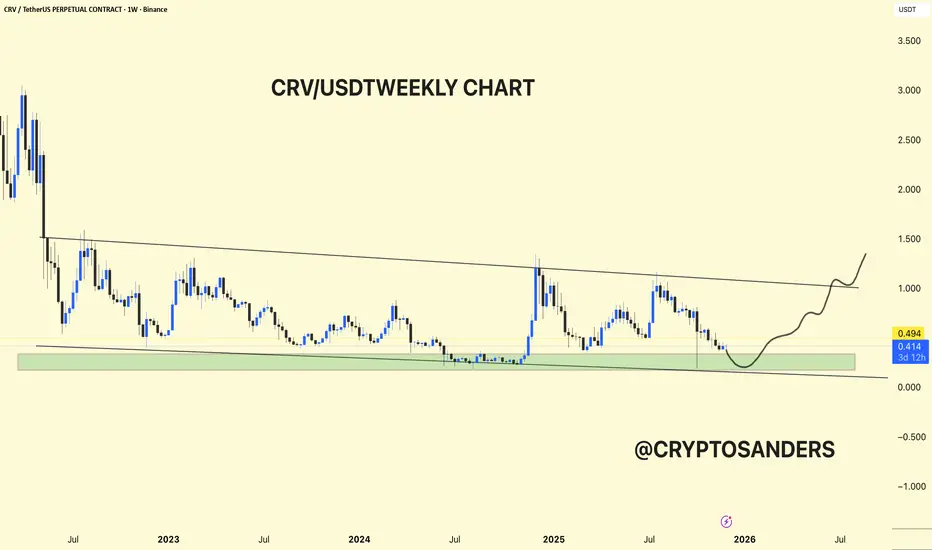
The weekly chart, CRV/USDT, is still in a long-term downtrend, but within a large accumulation support zone, where strong surges have previously occurred.
The price has been following a large downward trendline since 2022, with each rally being rejected near that line and then retracing back towards the same horizontal green demand band around 0.35–0.45 USDT.
The current weekly candles are again parked in this green zone, which has repeatedly acted as a floor over the past few years, suggesting a higher-timeframe accumulation or base rather than a new breakdown so far.
The bullish view on the chart shows a rounded bottom forming at this support, followed by a potential move towards the downward trendline and then a breakout towards the 1.00–1.50 region if buyers can maintain momentum.
The bearish risk is that a clean weekly close below the green zone will invalidate the base and make room for a new lower low, so this support acts as a key invalidation zone for any medium to long-term bias.
DYOR | NFA
관련 발행물
면책사항
해당 정보와 게시물은 금융, 투자, 트레이딩 또는 기타 유형의 조언이나 권장 사항으로 간주되지 않으며, 트레이딩뷰에서 제공하거나 보증하는 것이 아닙니다. 자세한 내용은 이용 약관을 참조하세요.
관련 발행물
면책사항
해당 정보와 게시물은 금융, 투자, 트레이딩 또는 기타 유형의 조언이나 권장 사항으로 간주되지 않으며, 트레이딩뷰에서 제공하거나 보증하는 것이 아닙니다. 자세한 내용은 이용 약관을 참조하세요.