📉 🔴
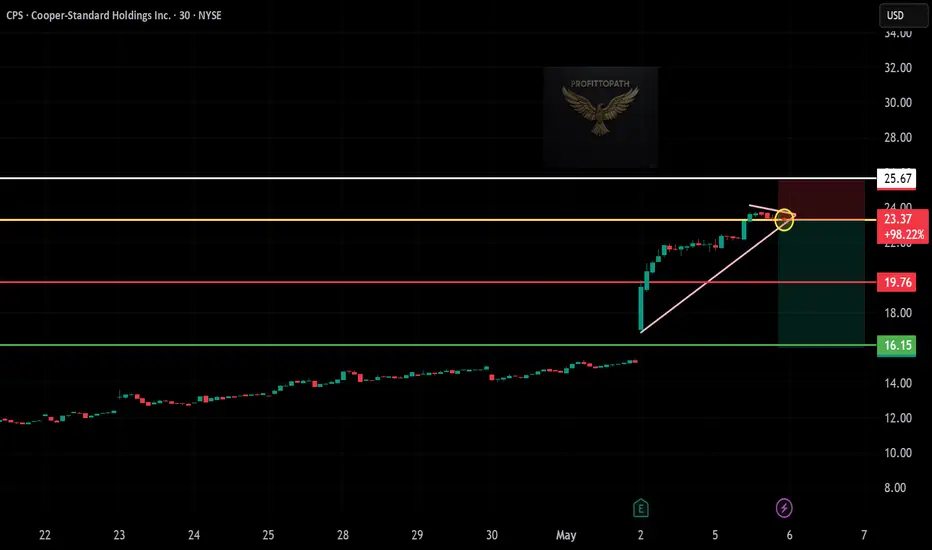
Ticker: CPS (Cooper-Standard Holdings Inc., NYSE: CPS)
Chart: 30-Minute Timeframe
Pattern: Rising wedge breakdown + trendline rejection
🔻 Entry: $23.37 (break below wedge + resistance rejection)
🔻 Stop-Loss: $25.67 (above wedge breakdown and structure)
🔻 Take Profits:
• TP1: $19.76 – First support zone
• TP2: $16.15 – Measured wedge breakdown target
⚖️ Risk-Reward:
• Risk/Share: $2.30
• Reward to TP2: $7.22
• R:R Ratio: ~1:3.1 ✅
🧠 Technical Highlights:
– Rising wedge pattern broken to downside
– Strong rejection at key resistance (yellow zone)
– Bearish confirmation after breakdown with retest
면책사항
해당 정보와 게시물은 금융, 투자, 트레이딩 또는 기타 유형의 조언이나 권장 사항으로 간주되지 않으며, 트레이딩뷰에서 제공하거나 보증하는 것이 아닙니다. 자세한 내용은 이용 약관을 참조하세요.
면책사항
해당 정보와 게시물은 금융, 투자, 트레이딩 또는 기타 유형의 조언이나 권장 사항으로 간주되지 않으며, 트레이딩뷰에서 제공하거나 보증하는 것이 아닙니다. 자세한 내용은 이용 약관을 참조하세요.