I had to Docukent this trade because it reminds of the time.
This time was slow.I tried to buy between two Moving Averages.
The 50 EMA and the 200 EMA.
Then I put a chart pattern.
This chart pattern is called the trendline support.
But there is a problem.
How do I use a chart pattern on forex trading?
And how do I trade with confidence so I used the following.
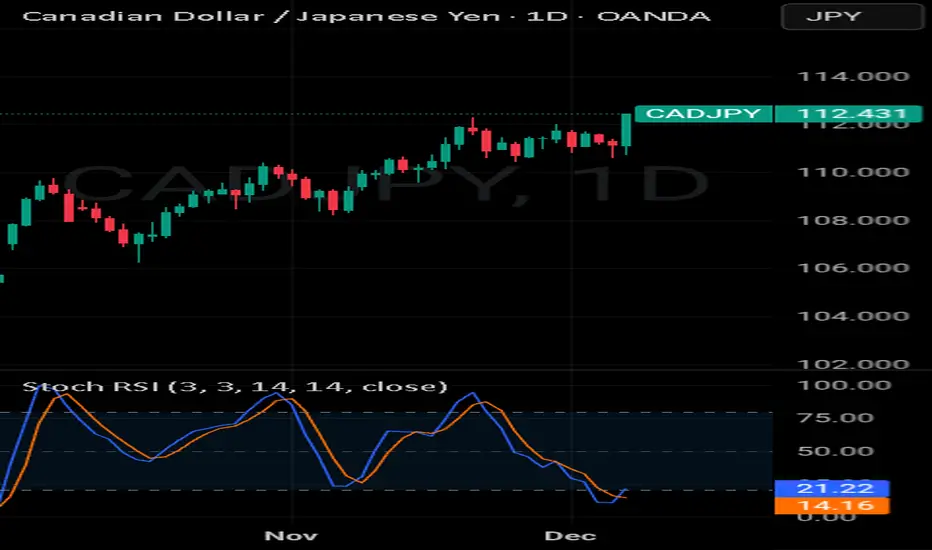
1-The trendline support
2-The Stochastic
3-RSI
These three tools are the mistakes that forex traders don't use.
Rocket boost this content to learn more.
Disclaimer ⚠️ Trading is risky please learn about risk management and profit taking strategies.
Also feel free to use a simulation trading account before you use real money.
This time was slow.I tried to buy between two Moving Averages.
The 50 EMA and the 200 EMA.
Then I put a chart pattern.
This chart pattern is called the trendline support.
But there is a problem.
How do I use a chart pattern on forex trading?
And how do I trade with confidence so I used the following.
1-The trendline support
2-The Stochastic
3-RSI
These three tools are the mistakes that forex traders don't use.
Rocket boost this content to learn more.
Disclaimer ⚠️ Trading is risky please learn about risk management and profit taking strategies.
Also feel free to use a simulation trading account before you use real money.
관련 발행물
면책사항
해당 정보와 게시물은 금융, 투자, 트레이딩 또는 기타 유형의 조언이나 권장 사항으로 간주되지 않으며, 트레이딩뷰에서 제공하거나 보증하는 것이 아닙니다. 자세한 내용은 이용 약관을 참조하세요.
면책사항
해당 정보와 게시물은 금융, 투자, 트레이딩 또는 기타 유형의 조언이나 권장 사항으로 간주되지 않으며, 트레이딩뷰에서 제공하거나 보증하는 것이 아닙니다. 자세한 내용은 이용 약관을 참조하세요.