👋🏻 Hey everyone! Hope you’re doing great! Welcome to SatoshiFrame channel.
✨ Today we’re diving into the 15-Mimutes Bitcoin analysis. Stay tuned and follow along!
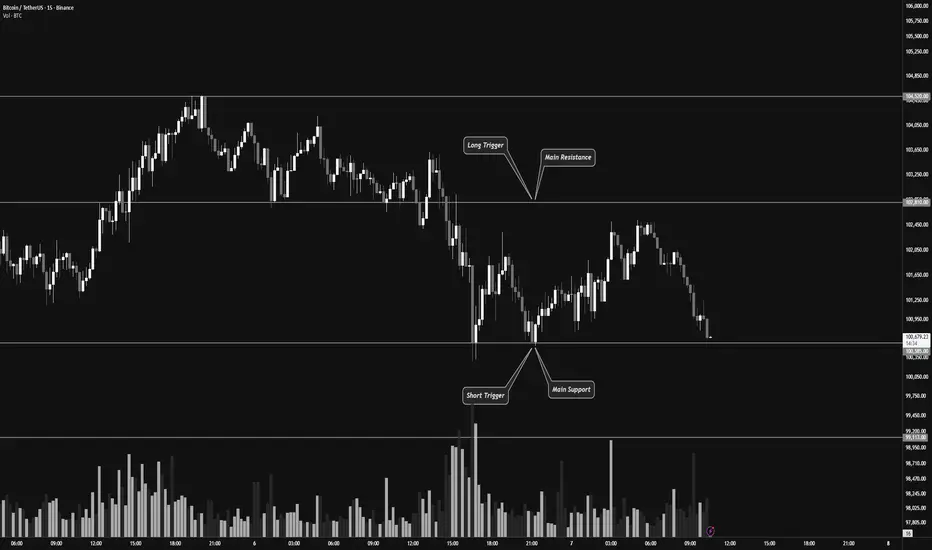
👀 On the 15-minute timeframe for Bitcoin, we can see that after breaking a multi-timeframe support, Bitcoin is currently testing its support zone around $100,585.
If this zone breaks, Bitcoin could continue its downward move and experience further decline.
However, if it moves upward and breaks the resistance zone around $102,810, it could trigger a potential trend reversal.
🕯 Pay attention to Bitcoin’s volume — the volume indicator currently shows an increase in selling pressure, suggesting that we might see a short-term volume consolidation before the price continues downward again.
✍️ The current scenarios for Bitcoin include both long and short setups, which you can use to plan your trades based on how the market reacts.
🟢 Long Position Scenario : A break above the $102,810 resistance zone, accompanied by increasing buy volume and bullish momentum, could signal a good long opportunity toward higher levels.
🟥 Short Position Scenario : A break below the $100,585 support zone, along with increasing sell pressure turning into strong selling momentum, could offer a short opportunity in line with the current trend.
❤️ Disclaimer : This analysis is purely based on my personal opinion and I only trade if the stated triggers are activated .
✨ Today we’re diving into the 15-Mimutes Bitcoin analysis. Stay tuned and follow along!
👀 On the 15-minute timeframe for Bitcoin, we can see that after breaking a multi-timeframe support, Bitcoin is currently testing its support zone around $100,585.
If this zone breaks, Bitcoin could continue its downward move and experience further decline.
However, if it moves upward and breaks the resistance zone around $102,810, it could trigger a potential trend reversal.
🕯 Pay attention to Bitcoin’s volume — the volume indicator currently shows an increase in selling pressure, suggesting that we might see a short-term volume consolidation before the price continues downward again.
✍️ The current scenarios for Bitcoin include both long and short setups, which you can use to plan your trades based on how the market reacts.
🟢 Long Position Scenario : A break above the $102,810 resistance zone, accompanied by increasing buy volume and bullish momentum, could signal a good long opportunity toward higher levels.
🟥 Short Position Scenario : A break below the $100,585 support zone, along with increasing sell pressure turning into strong selling momentum, could offer a short opportunity in line with the current trend.
❤️ Disclaimer : This analysis is purely based on my personal opinion and I only trade if the stated triggers are activated .
관련 발행물
면책사항
해당 정보와 게시물은 금융, 투자, 트레이딩 또는 기타 유형의 조언이나 권장 사항으로 간주되지 않으며, 트레이딩뷰에서 제공하거나 보증하는 것이 아닙니다. 자세한 내용은 이용 약관을 참조하세요.
면책사항
해당 정보와 게시물은 금융, 투자, 트레이딩 또는 기타 유형의 조언이나 권장 사항으로 간주되지 않으며, 트레이딩뷰에서 제공하거나 보증하는 것이 아닙니다. 자세한 내용은 이용 약관을 참조하세요.