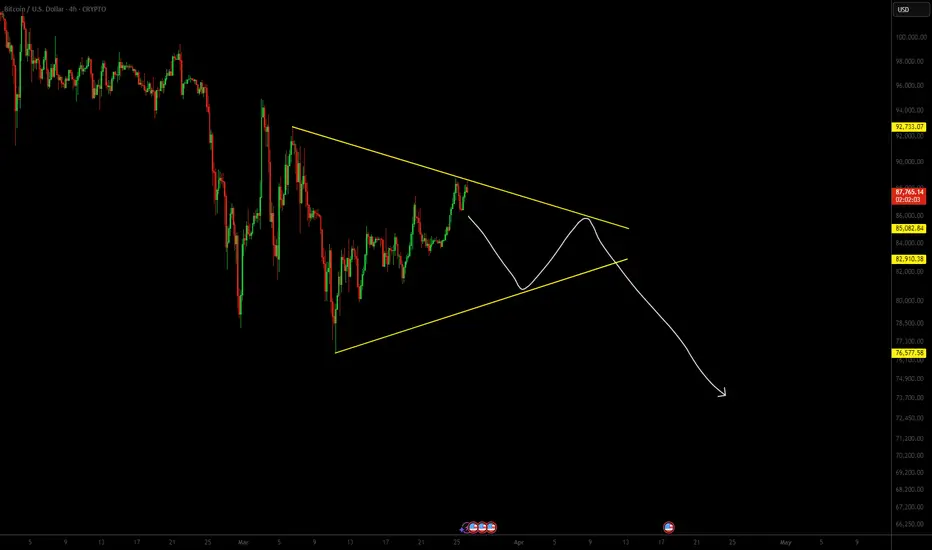
In today’s analysis, we are focusing on Bitcoin’s intraday price action, where a potential triangle formation appears to be taking shape. However, more data is needed to confirm this pattern. From a non-biased perspective, price action is still projecting lower highs, and for a bullish shift to occur, we need to see a transition into higher lows.
Currently, Bitcoin is testing the 0.618 Fibonacci level, which aligns with dynamic support/resistance (SR) resistance. If a rejection is confirmed, it could lead to a liquidity sweep at lower levels, ultimately testing dynamic SR support. This would further validate the triangle formation, providing an equilibrium zone for price to break out of.
Key Takeaways:
• Bitcoin remains in a lower high structure, needing a shift to higher lows for a bullish transition.
• Price action is testing the 0.618 Fibonacci retracement, which aligns with dynamic SR resistance.
• A confirmed rejection could lead to lower levels, testing dynamic SR support and reinforcing the triangle formation.
• Volume remains low, and a breakout will need increasing volume to be considered valid.
At this stage, Bitcoin is likely to remain range-bound in equilibrium unless a breakout occurs in the next few hours. If no breakout materializes, price action will likely continue to trend towards dynamic SR support. Traders should monitor volume levels closely, as an increase in volume will indicate a true breakout direction.
Join the Free Trading Group
Telegram: t.me/freetradingden 🔥
Claim $1000 Deposit Bonus 🎁
Trade with perks & support the community!
partner.blofin.com/d/TheAlchemist
Stay sharp, trade smart.
— Team The Alchemist ⚔️
Telegram: t.me/freetradingden 🔥
Claim $1000 Deposit Bonus 🎁
Trade with perks & support the community!
partner.blofin.com/d/TheAlchemist
Stay sharp, trade smart.
— Team The Alchemist ⚔️
면책사항
해당 정보와 게시물은 금융, 투자, 트레이딩 또는 기타 유형의 조언이나 권장 사항으로 간주되지 않으며, 트레이딩뷰에서 제공하거나 보증하는 것이 아닙니다. 자세한 내용은 이용 약관을 참조하세요.