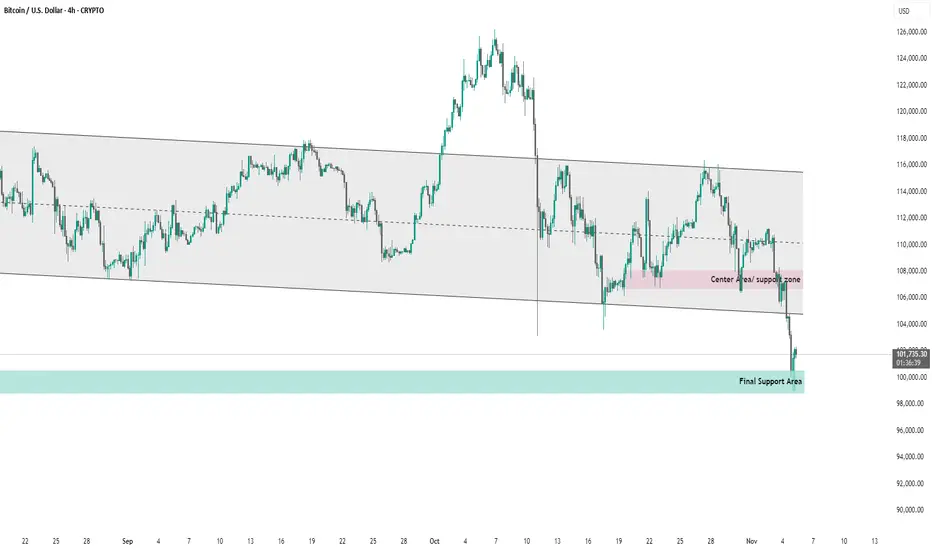
This chart shows Bitcoin (BTC/USD) price action on the 4-hour timeframe within a descending channel.
The price has consistently respected the upper and lower bounds of the channel, indicating a prevailing downtrend.
A center area/support zone around $107,000–$109,000 acted as interim support but has recently been broken.
The price has now reached the final support area near $100,000–$101,000, which is currently being tested.
If this final support fails, it could signal a continuation of the bearish trend; otherwise, a bounce from this level might lead to a short-term retracement toward the mid-channel zone.
Overall, the chart highlights a critical support test within a broader bearish structure.
관련 발행물
면책사항
해당 정보와 게시물은 금융, 투자, 트레이딩 또는 기타 유형의 조언이나 권장 사항으로 간주되지 않으며, 트레이딩뷰에서 제공하거나 보증하는 것이 아닙니다. 자세한 내용은 이용 약관을 참조하세요.
면책사항
해당 정보와 게시물은 금융, 투자, 트레이딩 또는 기타 유형의 조언이나 권장 사항으로 간주되지 않으며, 트레이딩뷰에서 제공하거나 보증하는 것이 아닙니다. 자세한 내용은 이용 약관을 참조하세요.