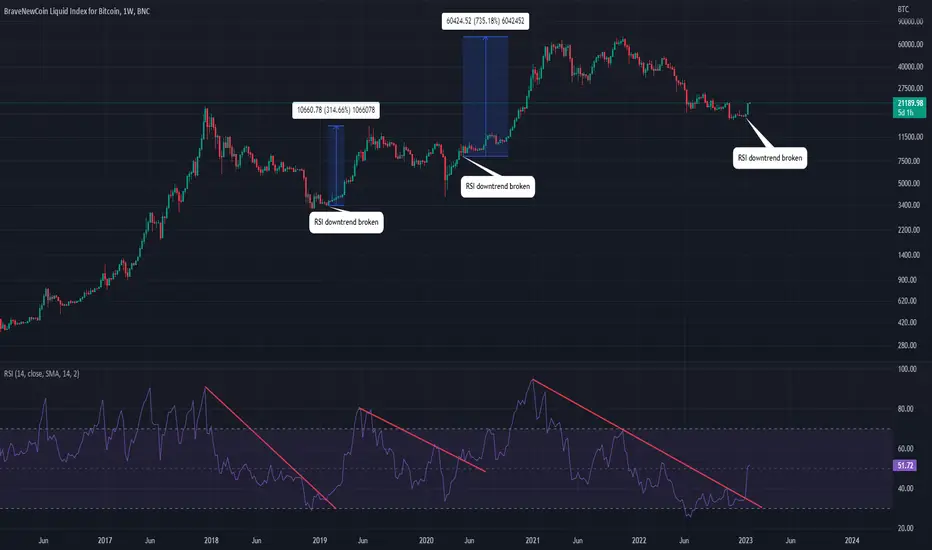
BTC has just recently breached its 2 year downtrend on the RSI. This is a very bullish indicator for the longer term. If we look back at 2018 we can see the RSI had a similar downwards sloping trendline that when broken led to a 300%+ pump. The second time this happened was during 2020. We had our downwards sloping trendline, broke above it and flipped it into new support before going on a 750%+ rally. Current day, we have just broken our downwards sloping trendline and have already almost pumped 40%. This does not mean we cannot have a retracement in the short term, but from a weekly perspective the bottom looks like it is in!
면책사항
이 정보와 게시물은 TradingView에서 제공하거나 보증하는 금융, 투자, 거래 또는 기타 유형의 조언이나 권고 사항을 의미하거나 구성하지 않습니다. 자세한 내용은 이용 약관을 참고하세요.
면책사항
이 정보와 게시물은 TradingView에서 제공하거나 보증하는 금융, 투자, 거래 또는 기타 유형의 조언이나 권고 사항을 의미하거나 구성하지 않습니다. 자세한 내용은 이용 약관을 참고하세요.