📈 Current Price and Trend
Current Price: ₹1,931.10
1-Month Price Change: Approximately +2.62%
52-Week Range: ₹1,521.20 – ₹2,419.95
Recent High: ₹1,964.70 on October 10, 2025
📊 Key Technical Indicators
RSI (14): 47.98 — Neutral, indicating neither overbought nor oversold conditions.
Stochastic RSI (14): 0.13 — Suggests a strong downtrend.
CCI (14): -69.38 — Indicates a downtrend.
MACD (12,26): 8.68 — Bullish crossover, suggesting upward momentum.
ADX (14): 30.75 — Indicates a strong trend.
Williams %R: -38.13 — Bullish, but not yet in the overbought zone.
ATR (14): 19.24 — High volatility.
ROC (12): 1.89 — Positive, indicating upward momentum.
Bull/Bear Power (13): 55.87 — Indicates bullish strength.
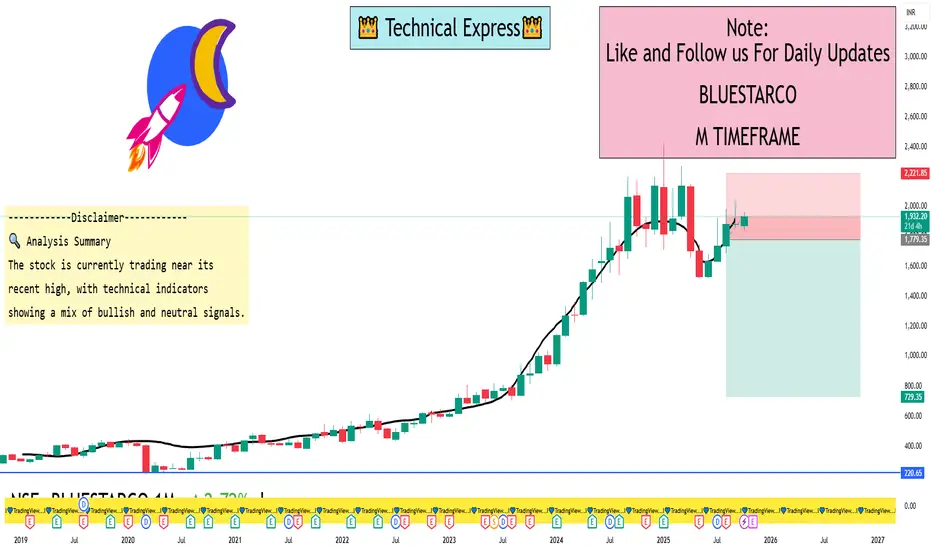
🔍 Analysis Summary
The stock is currently trading near its recent high, with technical indicators showing a mix of bullish and neutral signals. The RSI and Stochastic RSI suggest a neutral to slightly bearish short-term outlook, while the MACD, ADX, and Williams %R indicate potential for continued upward momentum. The high ATR value points to increased volatility, which traders should consider when making decisions.
Current Price: ₹1,931.10
1-Month Price Change: Approximately +2.62%
52-Week Range: ₹1,521.20 – ₹2,419.95
Recent High: ₹1,964.70 on October 10, 2025
📊 Key Technical Indicators
RSI (14): 47.98 — Neutral, indicating neither overbought nor oversold conditions.
Stochastic RSI (14): 0.13 — Suggests a strong downtrend.
CCI (14): -69.38 — Indicates a downtrend.
MACD (12,26): 8.68 — Bullish crossover, suggesting upward momentum.
ADX (14): 30.75 — Indicates a strong trend.
Williams %R: -38.13 — Bullish, but not yet in the overbought zone.
ATR (14): 19.24 — High volatility.
ROC (12): 1.89 — Positive, indicating upward momentum.
Bull/Bear Power (13): 55.87 — Indicates bullish strength.
🔍 Analysis Summary
The stock is currently trading near its recent high, with technical indicators showing a mix of bullish and neutral signals. The RSI and Stochastic RSI suggest a neutral to slightly bearish short-term outlook, while the MACD, ADX, and Williams %R indicate potential for continued upward momentum. The high ATR value points to increased volatility, which traders should consider when making decisions.
I built a Buy & Sell Signal Indicator with 85% accuracy.
📈 Get access via DM or
WhatsApp: wa.link/d997q0
Contact - +91 76782 40962
| Email: techncialexpress@gmail.com
| Script Coder | Trader | Investor | From India
📈 Get access via DM or
WhatsApp: wa.link/d997q0
Contact - +91 76782 40962
| Email: techncialexpress@gmail.com
| Script Coder | Trader | Investor | From India
관련 발행물
면책사항
해당 정보와 게시물은 금융, 투자, 트레이딩 또는 기타 유형의 조언이나 권장 사항으로 간주되지 않으며, 트레이딩뷰에서 제공하거나 보증하는 것이 아닙니다. 자세한 내용은 이용 약관을 참조하세요.