Trade Alert
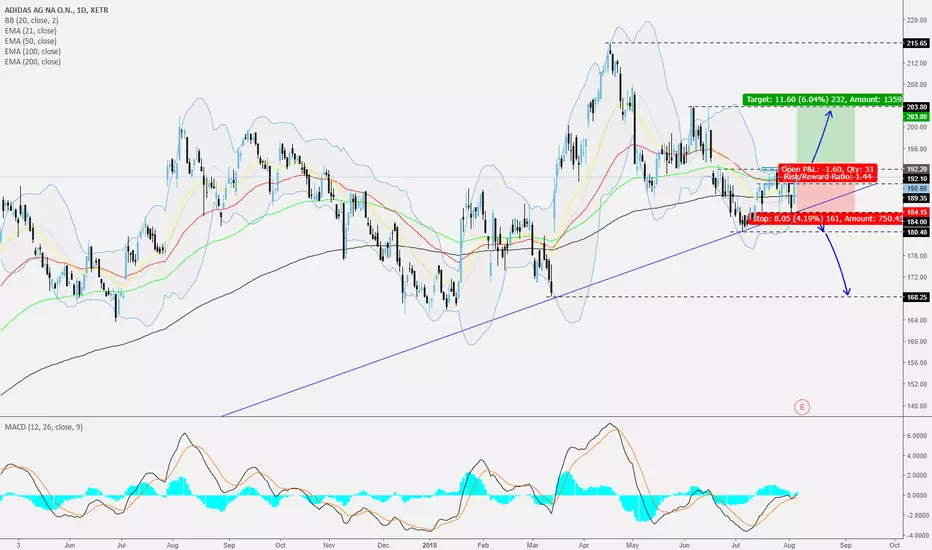
We can see that Adidas recently tested the long-term upwards moving trendline, taken from the lowest point of August 2015, from which it quickly rebounded. Also, the stock is aiming for the 192.10 resistance level, a break of which could set the stage for a potential move higher (Please see the chart for details).
Alternatively, for us to turn bearish on the stock, we would need to see a break and a close below the aforementioned upwards moving trendline. This way we could start targeting lower support levels (Please see the chart for details).
Always have your stop-loss in place.
면책사항
해당 정보와 게시물은 금융, 투자, 트레이딩 또는 기타 유형의 조언이나 권장 사항으로 간주되지 않으며, 트레이딩뷰에서 제공하거나 보증하는 것이 아닙니다. 자세한 내용은 이용 약관을 참조하세요.
면책사항
해당 정보와 게시물은 금융, 투자, 트레이딩 또는 기타 유형의 조언이나 권장 사항으로 간주되지 않으며, 트레이딩뷰에서 제공하거나 보증하는 것이 아닙니다. 자세한 내용은 이용 약관을 참조하세요.