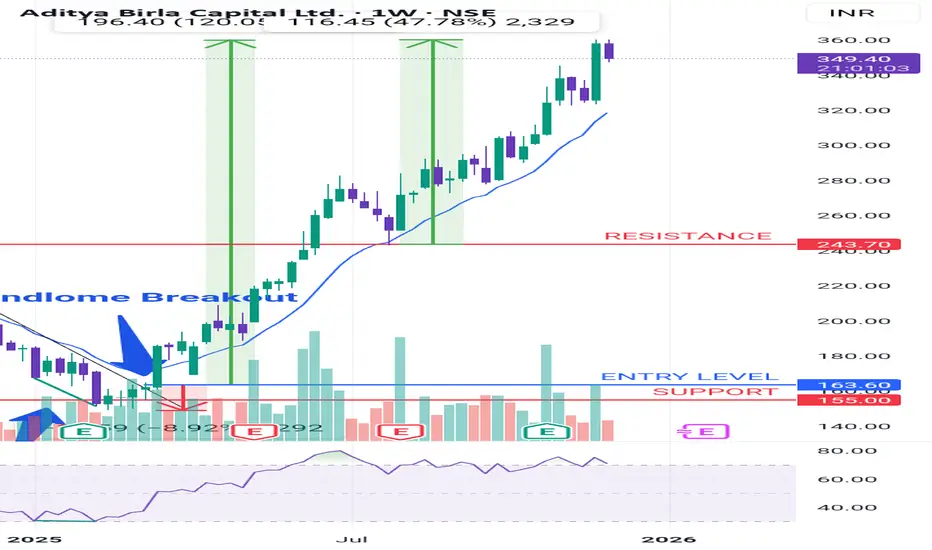
In weekly chart of ABCAPITAL there was RSI Divergence in first quarter of Year 2025. It made a Trendline Breakout in second week of March 2025
And gave entry above breakout candle weekly close at 163.6 and then with a risk of 9% it gave one sided returns of Risk:Reward of 1:13
Curent Return at 120%
It retested resistance level of 243.7 which corresponded 21-EMA in july 2025 and again gave return of 45% from the resistance level
It is again forming a Bearish RSI Divergence. But bullish trend is intact till it gives a weekly close below 21-EMA
면책사항
해당 정보와 게시물은 금융, 투자, 트레이딩 또는 기타 유형의 조언이나 권장 사항으로 간주되지 않으며, 트레이딩뷰에서 제공하거나 보증하는 것이 아닙니다. 자세한 내용은 이용 약관을 참조하세요.
면책사항
해당 정보와 게시물은 금융, 투자, 트레이딩 또는 기타 유형의 조언이나 권장 사항으로 간주되지 않으며, 트레이딩뷰에서 제공하거나 보증하는 것이 아닙니다. 자세한 내용은 이용 약관을 참조하세요.